This seems to happen every year around this time. People are finishing up summer vacations, getting kids into school, and tackling other tasks that naturally create a drop in search volume for many business sectors. These anamolies explain a drop in click volume in Google Ads, but what about other drops in volume that seem to be unexplainable?
If you use Google Ads to generate business like I do, you should be monitoring your clicks. If you notice a big drop off in the click volume of your campaigns, you have reason to be alarmed. That’s potential business you could be missing out on! Fortunately, I have 6 steps you can take to troubleshoot a drop in Google Ads volume.
1 – Check the Graph
When I notice a decline in activity from Google Ads, the first thing I do is look at the graph that appears at the top of every Google Ads dashboard. This graph can be a great measure of your day-to-day clicks and costs, but can also provide a quick visual view of other metrics like impressions or average ranking position. By changing the time frame displayed you can look back to the past few weeks or even months and determine the approximate days where your Google Ads volume started to decline.
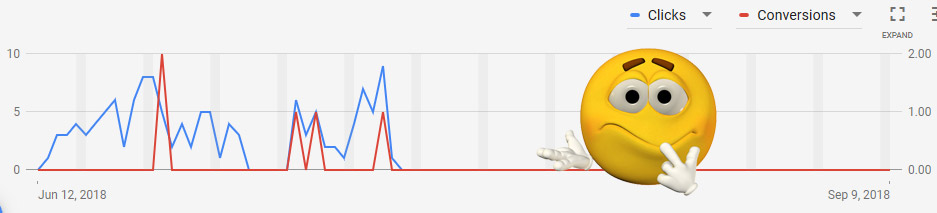
This won’t fix anything but will serve to confirm your suspicion that volume did indeed drop. If you don’t see a drop in the graph, there may be other problems that are causing a lower conversion rate like your website is loading slow – for example, your new higher prices are scaring people away or your phone number is wrong!
2 – View the Change History
If you do confirm a drop in clicks volume, the next thing you’ll want to investigate is your Change History. This will show you all the changes either you or someone else has made to your account. You want to especially look at the days surrounding right before the time-frame where you discovered the drop in click volume.
Was a major change made at the time in question that could have caused the drop in volume? A decrease in budget? A paused campaign? Deleted keywords?
If you’re able to find the change that caused a drop in volume in the Change History, you should be able to undo that change and watch your Google Ads volume rebound over the next few days.
3 – Check Auction Insights Report
This is a pretty big one — big enough that I did an entire video specifically on the Auction Insights Report. In this report you are looking at competitor Impression Share.
Here’s how I use the Auction Insights Report to diagnose drops in volume:
Look at the report from 30 days ago, and then, compare it to the report from 30 days before that. You may find that you’re getting a significantly smaller % of Impression Share in the last 30 days compared to the 30 day period before that. This could be because new competitors have entered the marketplace and are now taking away a healthy chunk of the Impression Share. Or maybe competitors have increased their bids recently. Either way, you may have to up your game (and your bids) to compete.
4 – Compare Time Periods
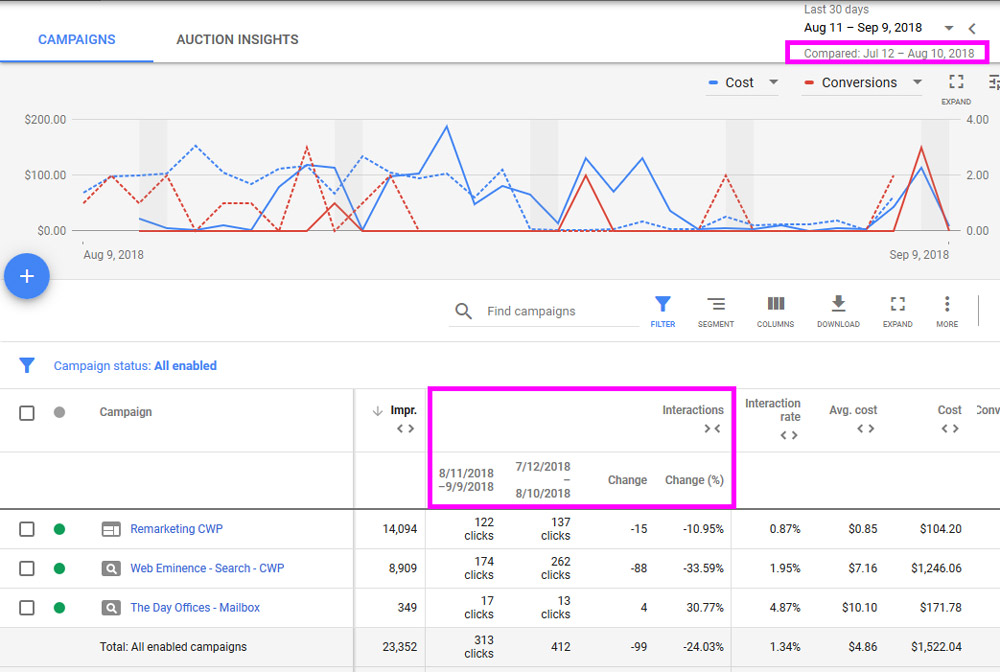
Time period comparison is a powerful and often overlooked feature in Google Ads stats that can aid in your mission to troubleshoot a drop in volume.
With this feature you can look at your graph with two separate time periods overlaid. Now you can compare the past 30 days with the past 30 days before that in one view — similar to the Auction Insights Report time comparison, but this one is all about you and not your competitors!
With expandable columns shown below, you’re given even more detail and the changes in % from period to period. Use this to determine where the greatest decrease in % is found. You can really dive deep here, getting down to the change in % at the keyword level.
5 – Look for Impression Share Changes
Another important topic that I’ve covered in the past is Impression Share, which is how much your ad is showing compared to how much it could show. Impression share can be added to your dashboard as a new column and you can then use the Compare feature mentioned above to see the change in % over the course of two time periods.
For more information be sure to watch Google Ads Impression Share – How Big Is Your SLICE OF PIE?
6 – Consider Quality Score
Finally, you should investigate your Quality Score, which ultimately helps determine your ad rank and volume. If you haven’t done so, adding a Quality Score column to your dashboard is incredibly helpful. Then you can compare your current score with your ‘Historical Quality Score,’ which shows your last known score. A drop in Quality Score could indicate why there aren’t as many people seeing your ads as there used to be.
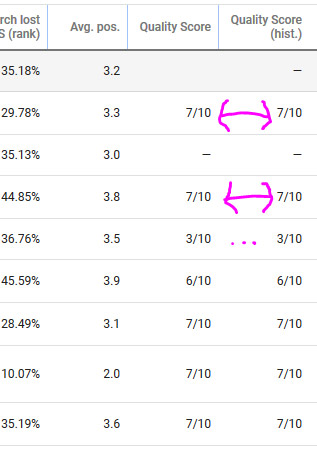
In this screenshot, the Quality Score and Quality Score (hist.) are the same so it rules out a Quality score drop as the reason for a volume drop.
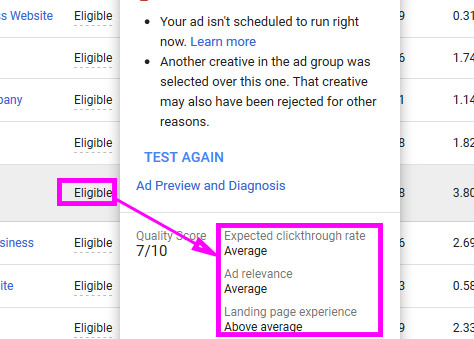
Scroll over the Status column for a keyword to pup up the status window that shows your individual quality score factors.
Threes factors make up your Quality Score:
- Expected clickthrough rate
- Ad relevance
- Landing page experience
In Google Ads you’re able to see which factor is dragging down your quality score and can strategize accordingly. You can view these individual factors by scrolling over the Status column for an individual keyword as shown above. Also read the Google Ads guide on optimizing for Quality Score here.
Consider Seasonality
Ultimately, the cause of your drop in Google Ads volume could be a number of different factors and the steps above should help you key in on the key factors at play.
It’s important to keep in mind that your business could be seasonal with regular drop-offs during the summer or Holiday seasons. As a business owner, you probably know this but you may not have considered it as a reason for a drop in traffic volume.
It could be that for a few weeks out of the month demand for your product/services went down and there’s really no obvious reason why. You could see a sharp increase and return to normal traffic without any changes over the next few days. These are normal fluctuations and rather than looking at day to day, I encourage my clients to view 30 day time periods when comparing so that they don’t drive themselves crazy trying to justify normal fluctuations in traffic.
Hopefully going through these 6 steps will help you recognize inconsistencies so you can take action when warranted instead of panicking unnecessarily!