
While reviewing a monthly Google Ads report for a client, I discovered an issue that wasn’t immediately obvious inside the standard Google Ads interface. By using a custom report built in Google Data Studio, I identified a geographic trend that completely changed our optimization strategy.
Why Geographic Performance Matters in Google Ads
For businesses targeting large metropolitan areas, advertising performance can vary significantly between cities, ZIP codes, and surrounding suburbs. A campaign may appear healthy overall, but when you break the data down by location, you’ll often find that certain areas generate high-quality leads while others consume a large portion of the budget with very few conversions.
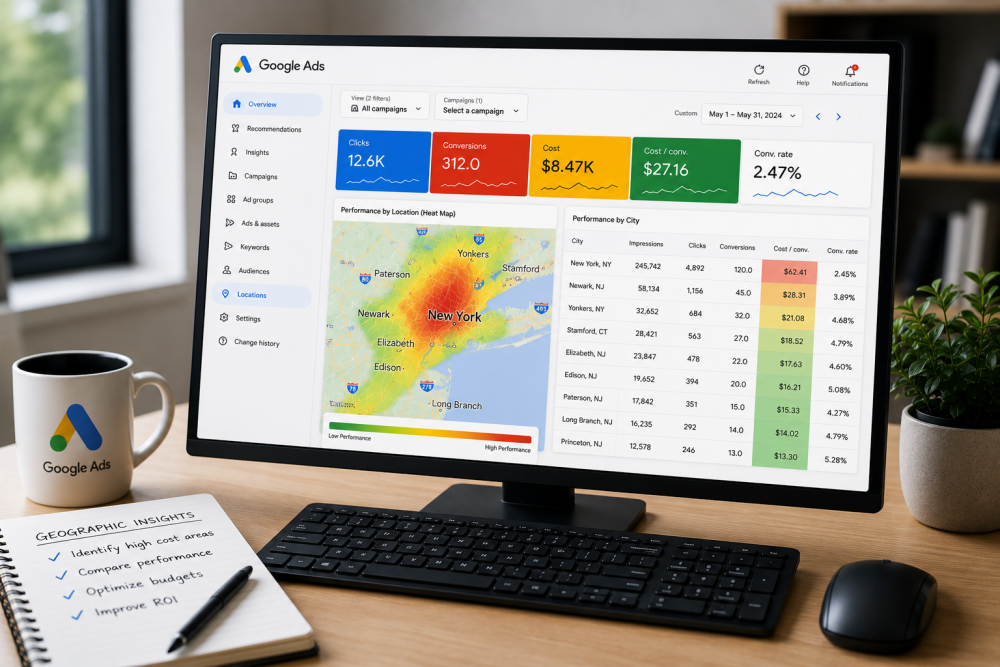
In this particular account, the client targeted New York City and parts of New Jersey using a radius-based campaign. At first glance, the campaign appeared to be performing reasonably well. However, a geographic heat map quickly revealed that the overwhelming majority of impressions and clicks were coming from New York City, which is expected given its population density.
The real insight came when comparing conversion metrics by location.
Although New York City generated the highest number of conversions, it also had by far the highest cost per conversion. Meanwhile, several surrounding areas generated fewer conversions overall but did so at a fraction of the cost, producing significantly better conversion rates and much stronger return on advertising spend.
Without this level of geographic reporting, it would have been easy to continue investing heavily in New York City simply because it generated the most traffic. In reality, the city’s poor conversion efficiency was dragging down the performance of the entire campaign.
The Limitations of the Google Ads Interface
Google Ads provides some location reporting, but finding meaningful geographic insights isn’t always straightforward.
The standard campaign dashboard includes maps and location summaries that display metrics such as clicks and impressions. While these visualizations are helpful for understanding overall traffic distribution, they don’t always make it easy to compare critical performance metrics like cost per conversion, conversion rate, or return on ad spend across multiple locations.
For advertisers using radius targeting instead of individual cities or ZIP codes, geographic analysis becomes even more challenging because the default reporting options provide limited visibility into how each area contributes to campaign performance.
As a result, many advertisers overlook location-based optimization opportunities simply because the data isn’t presented in an easy-to-analyze format.
Using Data Studio to Analyze Geographic Performance
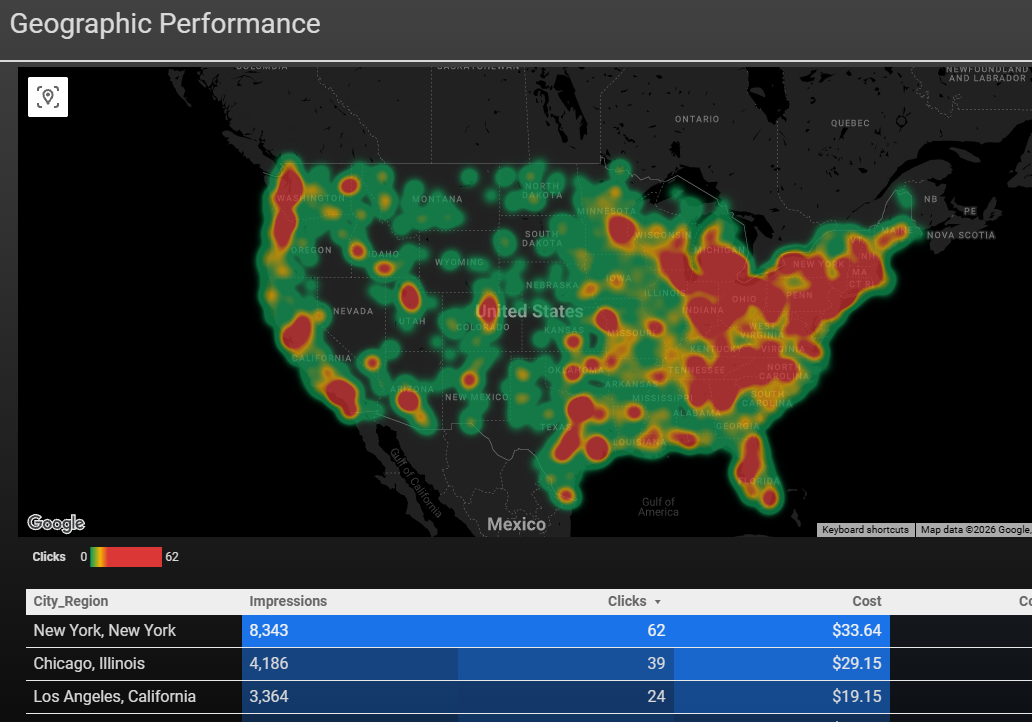
To gain better visibility into campaign performance, I built a custom Google Data Studio report that visualized geographic data using both an interactive heat map and a detailed location table.
The report displayed key performance metrics including:
- Impressions
- Clicks
- Conversions
- Cost
- Cost per Conversion
- Conversion Rate
By organizing the data by user location, it became immediately obvious which cities were producing profitable leads and which locations were consuming advertising budget without generating acceptable results.
This type of reporting makes it much easier to identify geographic outliers that would otherwise remain hidden inside the standard Google Ads interface.
Creating Geographic Reports Inside Google Ads
If you don’t use Data Studio, you can still perform similar analysis using the Google Ads Report Editor.
Inside the Report Editor, you can build a custom table by adding dimensions such as City or User Location, along with metrics including Clicks, Conversions, Cost, and Cost per Conversion. Organizing the data this way allows you to compare location performance much more effectively than relying on the default campaign views.
Although the visualization isn’t as polished as Data Studio, it provides enough information to identify geographic areas that deserve further optimization.
Turning Geographic Insights into Better Campaign Performance
Once poor-performing locations are identified, several optimization strategies become available.
In this campaign, New York City was generating volume but at an unsustainable cost per conversion. Rather than continuing to spend the majority of the advertising budget there, the next step was to test excluding New York City temporarily while allowing surrounding areas to receive more budget.
Another strategy under consideration was creating a separate Google Ads campaign dedicated exclusively to New York City. By using customized ad copy, location-specific landing pages, and independent bidding strategies, the campaign could be optimized specifically for that highly competitive market without affecting performance in surrounding regions.
Segmenting geographic areas into separate campaigns often provides greater control over budgets, bidding, messaging, and overall campaign profitability.
Why Geographic Reporting Should Be Part of Every Google Ads Audit
Many advertisers spend hours optimizing keywords, writing better ads, and adjusting bidding strategies while completely overlooking geographic performance. Yet location data can have a dramatic impact on campaign profitability.
Regularly reviewing cost per conversion, conversion rate, and return on ad spend by city or region helps identify opportunities to improve efficiency without increasing advertising spend. In many cases, simply reallocating budget toward higher-performing locations can significantly improve overall campaign performance.
Whether you use Google Data Studio or the Google Ads Report Editor, creating custom geographic reports provides insights that aren’t always visible in the standard Google Ads interface. For businesses targeting multiple cities, counties, or metropolitan areas, this type of analysis should be a routine part of every optimization strategy.
Final Thoughts
Location targeting is one of the most powerful—but often underutilized—optimization tools available in Google Ads. Looking beyond campaign averages and analyzing geographic performance can reveal hidden inefficiencies that dramatically affect your results.
By identifying high-performing and low-performing locations, advertisers can make smarter decisions about budget allocation, campaign structure, and local targeting. Whether that means excluding expensive areas, creating dedicated campaigns for competitive markets, or building location-specific landing pages, geographic reporting provides the data needed to improve lead quality and reduce acquisition costs.
If you’re managing your own Google Ads campaigns, consider building a custom location report using Google Data Studio or the Google Ads Report Editor. The insights you uncover could significantly improve campaign performance and help you get more value from your advertising budget.