As a small business owner, you may not have a big staff (it might be just you!), so you could find yourself having to monitor your own stats. With that in mind, let’s dive in and discuss what you should be looking for within your Google Analytics data and HOW to setup Google Analytics.
Set Up Google Analytics
You may already have Google Analytics installed on your site and not know it, but there are a few ways to check. I prefer Google Tag Assistant, the Google Chrome extension that lists all the tags on any given page. There are also sites like gachecker.com where you can paste your URL and receive a checklist of Analytics tags for your site.
If it’s not installed you can setup a free account at google.com/analytics. All you need to open an account is an account name, the site name, and the full URL of your site.
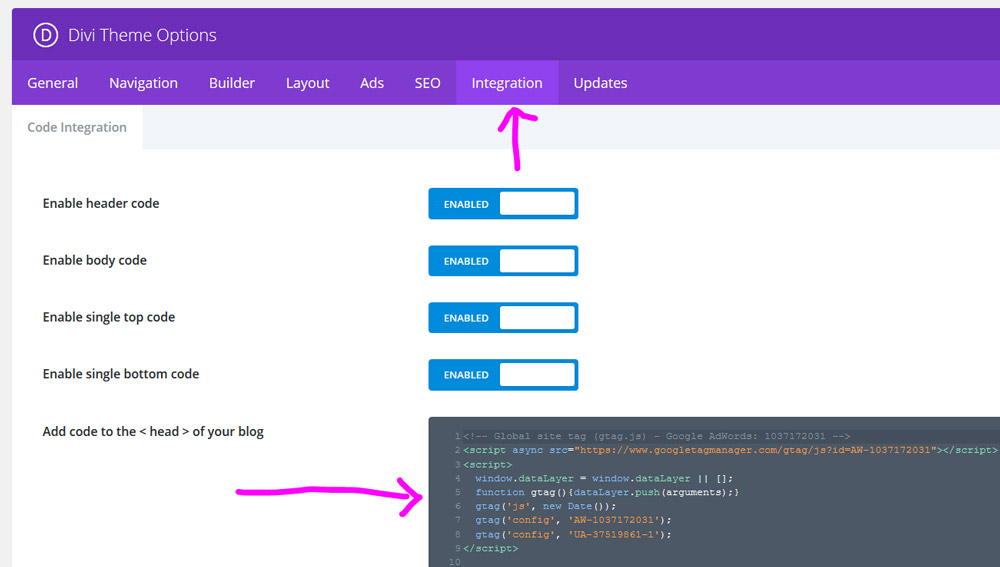
From there you’ll receive a Tracking ID and Global Site Tag. The Global Site Tag is the code that will need to be added to header of every page within your site. This is the part that makes people the most anxious. But don’t worry! You don’t need to be an expert programmer to add this code. Often your WordPress theme will have a built-in section where you can simply copy and paste it. Below you can see where I can paste the Google Analytics code into the Divi theme which is a popular theme I use. Check out my video above for an overview of this.
There are also plug-ins. Tracking Code Manager is one that I use, and there’s even a free version! Again a quick copy and paste feature will drop the Google Analytics code right where it needs to go. If you’re a novice this is definitely preferred as trying to manually place the code yourself can lead to breaking your site.
Once that’s done, you can go back and re-verify that Google Analytics is setup using the Tag Assistant extension or gatracker.com mentioned above. You can also just wait for some data to accumulate in Google Analytics which will prove that it is setup correctly.
What To Look for in Google Analytics?
Now that you’re all set-up it’s time to start harnessing all of that valuable data. Google Analytics can be quite complex and there are many, many features and ways to interpret these numbers and graphs. For the sake of simplicity, we’ll take a broad look at the sections that I’ve found to be most helpful for small businesses.
Audience
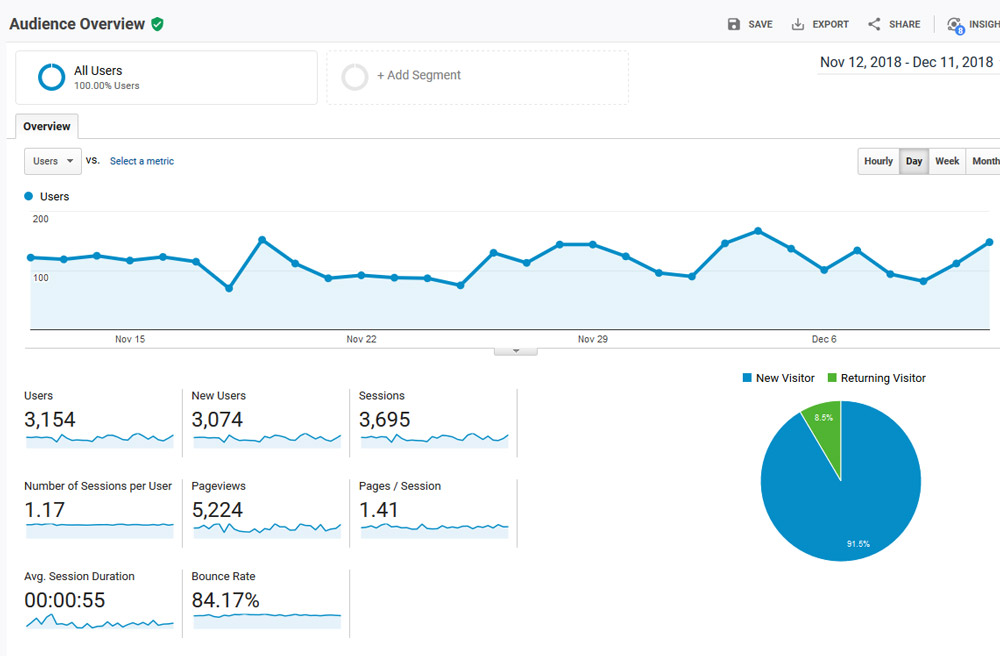
The Audience tab will provide you with the numbers of users visiting your site. Analytics tracks what they call “sessions,” which is the overall number of visitors. This is different from just your number of users as it also counts repeat visits. Still, Sessions is usually the main number that people look at in Google Analytics.
Analytics makes things visual when it can, like in this section, where you’ll see a pie graph that will tell you what percentage of your visitors are new vs. returning.
Within this tab you can also see page views, how many pages are visited per session, and how long those sessions last ( or how long they stay on your site on average). You can also track your overall bounce rate, which is the percentage of people who leave your site after only visiting one page. Obviously lower is better but anything below 70% is pretty good.
Acquisition
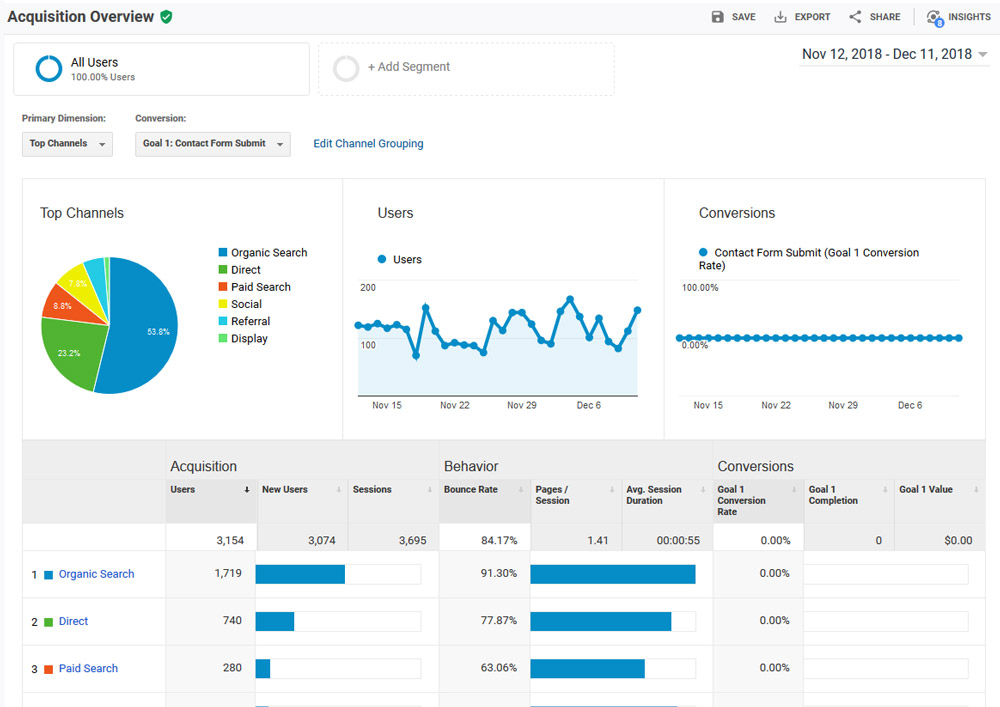
The Acquisition tab is going to tell you where all of that Audience traffic is actually coming from. There is another handy pie graph here that tells you what is directing people to land on your site. This could be organic search, direct (like a click from an email or your URL being entered manually), referral (a click from another site), paid search, and a few others.
You can dive deeper into this info to see exactly how many users came from each source and individual bounce rates, average page duration, etc. for each source as well.
Behavior
There’s a bit of overlap within the Behavior tab and the Audience tab as you’ll get bounce rate stats and a few others here as well. What sets this section apart is the focus on the performance of individual pages.
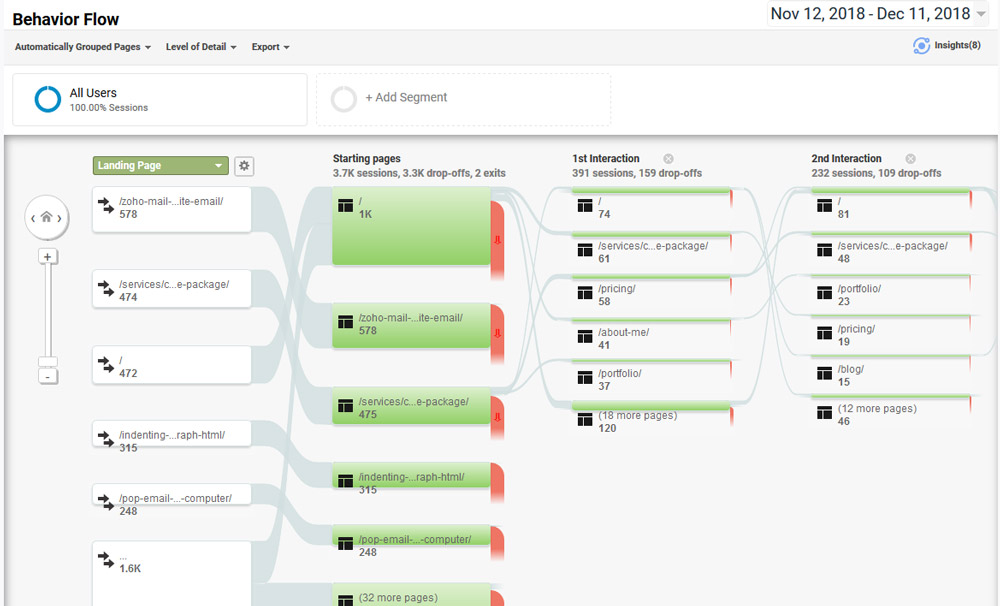
Want to know what page is getting the most views? Here you’ll find out and be able to update it or maybe determine what makes it stand above the rest. You’ll also get a Behavior Flow Chart (see above) which gives you a visual representation of where people start and how they progress through your site. Ultimately, it shows you right where they drop off, so you can consider why you may be losing visitors.
Real-Time
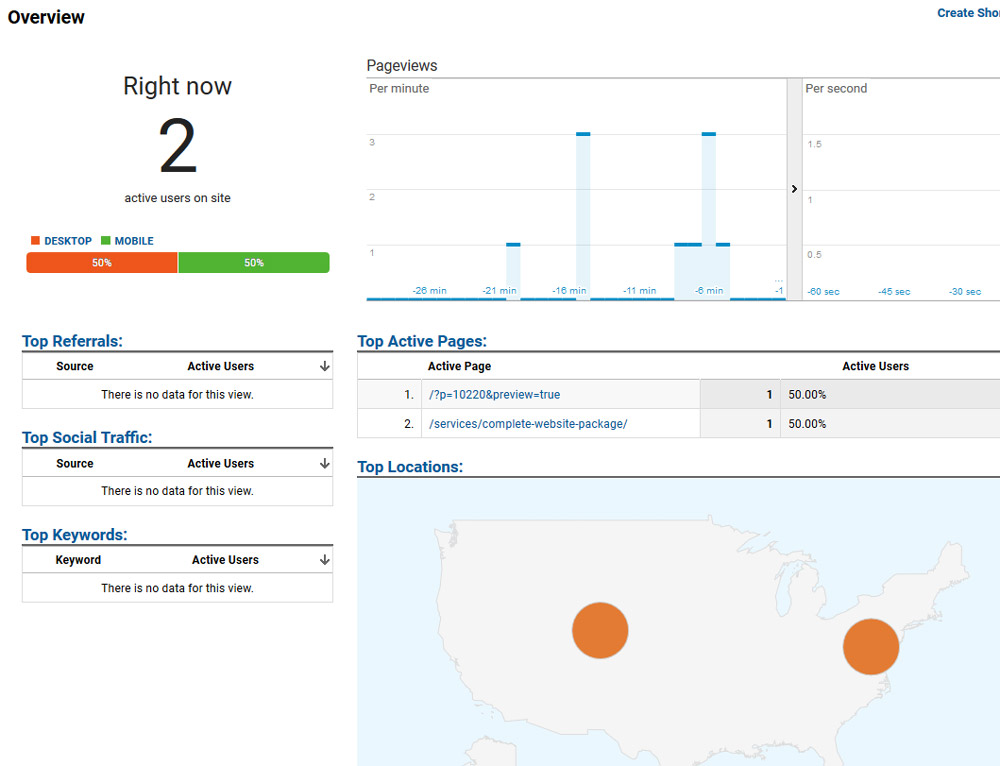
Honestly, this section might be more fun than useful, but it’s still worth talking about! In this section you can see who is actually on your page – right then at that very moment. This data might not be particularly helpful for lower traffic sites, but it serves as a great reminder that people are actually on your site. It can be a substantial motivator to continue to improve user experience of your highest traffic pages.
Like I said before, there is still a lot more you could dig into, but this should give you a barebones overview of what to look for when using Google Analytics as a small business. If you have questions, make sure to reach out or leave a comment below!